Data Visualization

Data Visualization
Data Visualization

Streamlining the work of nutrition analysis and fertilizer sales

Streamlining the work of nutrition analysis and fertilizer sales

Streamlining the work of nutrition analysis and fertilizer sales

Company

Nutrien is a global agriculture company that provides crop inputs and services. Agronomists that work at Nutrien partner with farmers to help them maximize their yields and work efficiently.


PRODUCT

Agronomists have a variety of sales goals they work to meet. This sales dashboard is a tool they can use to see how close they are to meeting those goals.

Skills Used
  • UI + Interaction Design

  • Prototyping in Figma

Getting Started

Getting Started

Getting Started

At Nutrien, we had a team of two designers who worked exclusively on the design system, which the UX team would then utilize to create their designs. Because of the symbiotic nature of UX and UI, I would frequently collaborate with the design systems team to exchange feedback and ideas. During this particular project, my task was to “pressure test” data visualization components with one of the systems designers, Levi.

What is pressure testing?
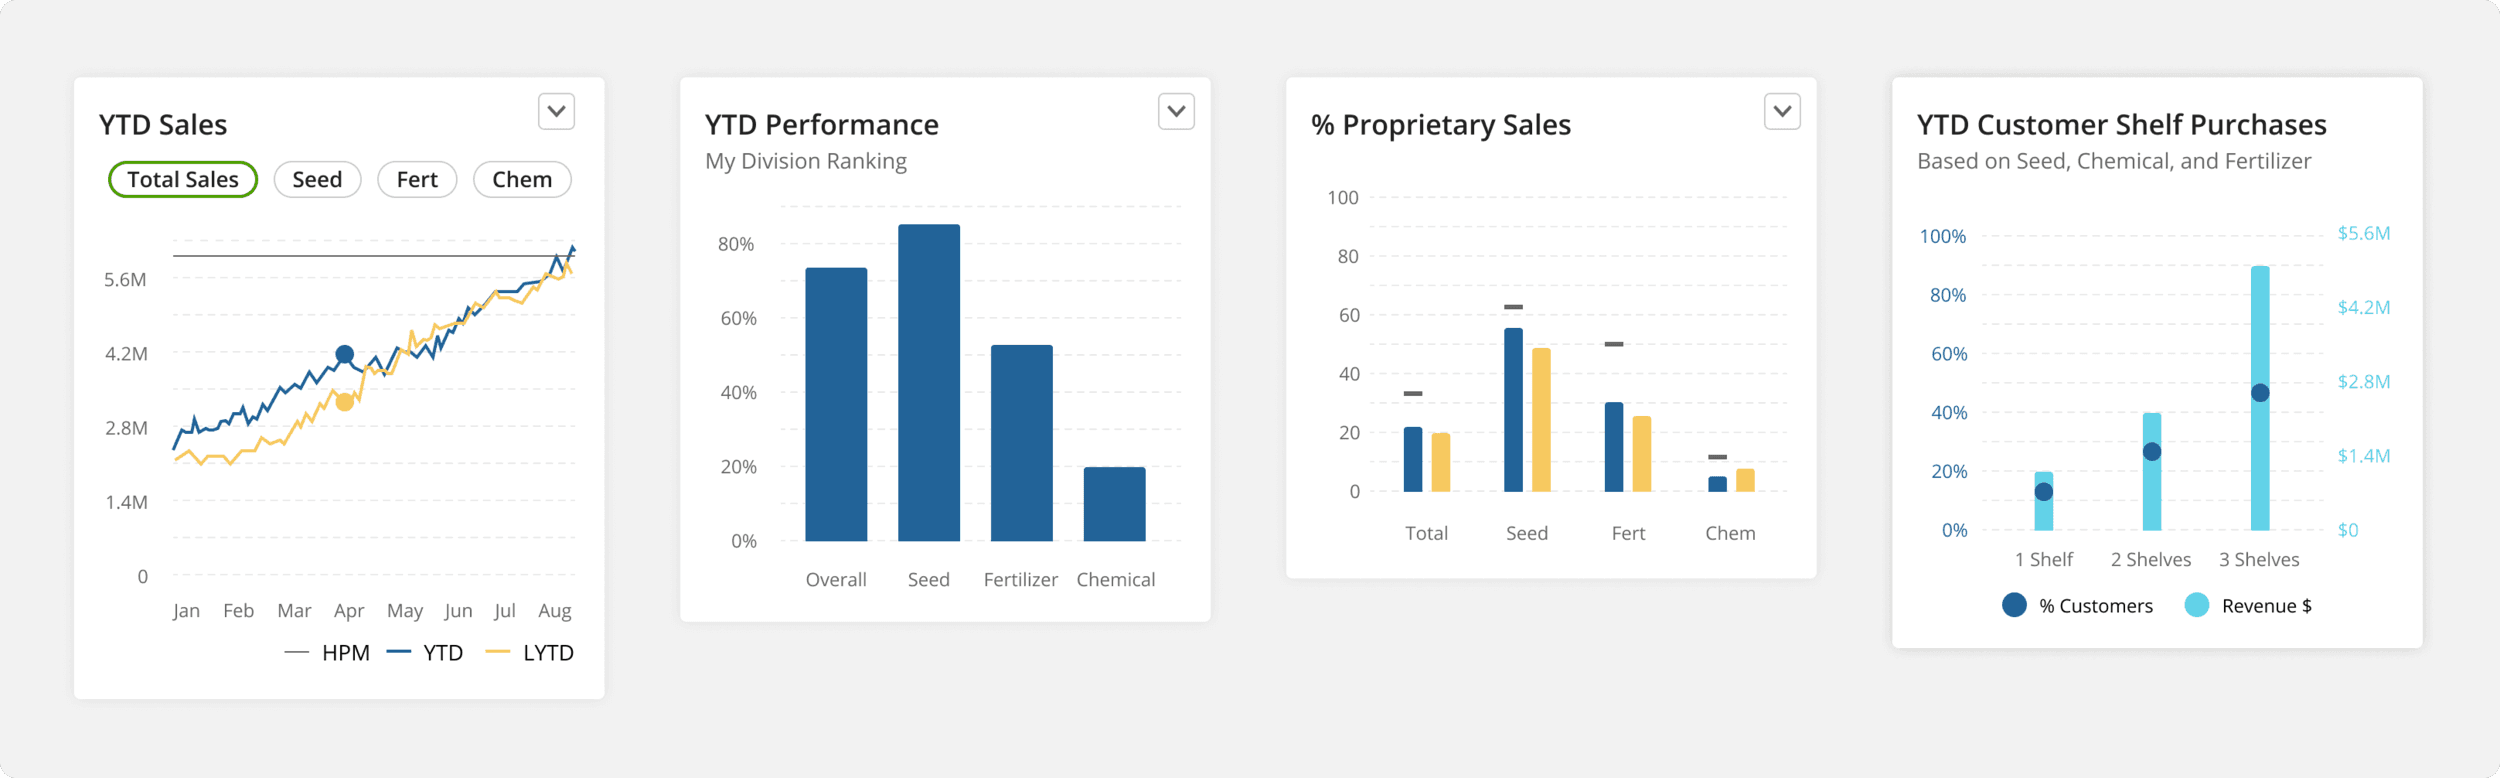
I took a basic set of line and bar graphs that Levi designed, and I put it in the context of a sales dashboard, using real data and context to see what elements would break down.

The images below show my first iteration while I was getting a feel for the data and tinkering with the layout and hierarchy.

Iteration

Iteration

Iteration

After speaking with a user and learning that ‘Total Sales’ is most important to them, I made that the main focus of the page. This helps to create hierarchy so the user has a sense of what to look at first.

A common mistake made on dashboards is making all cards or content areas the same size. The business creates a lack of focus and is therefore more difficult for the user to digest.

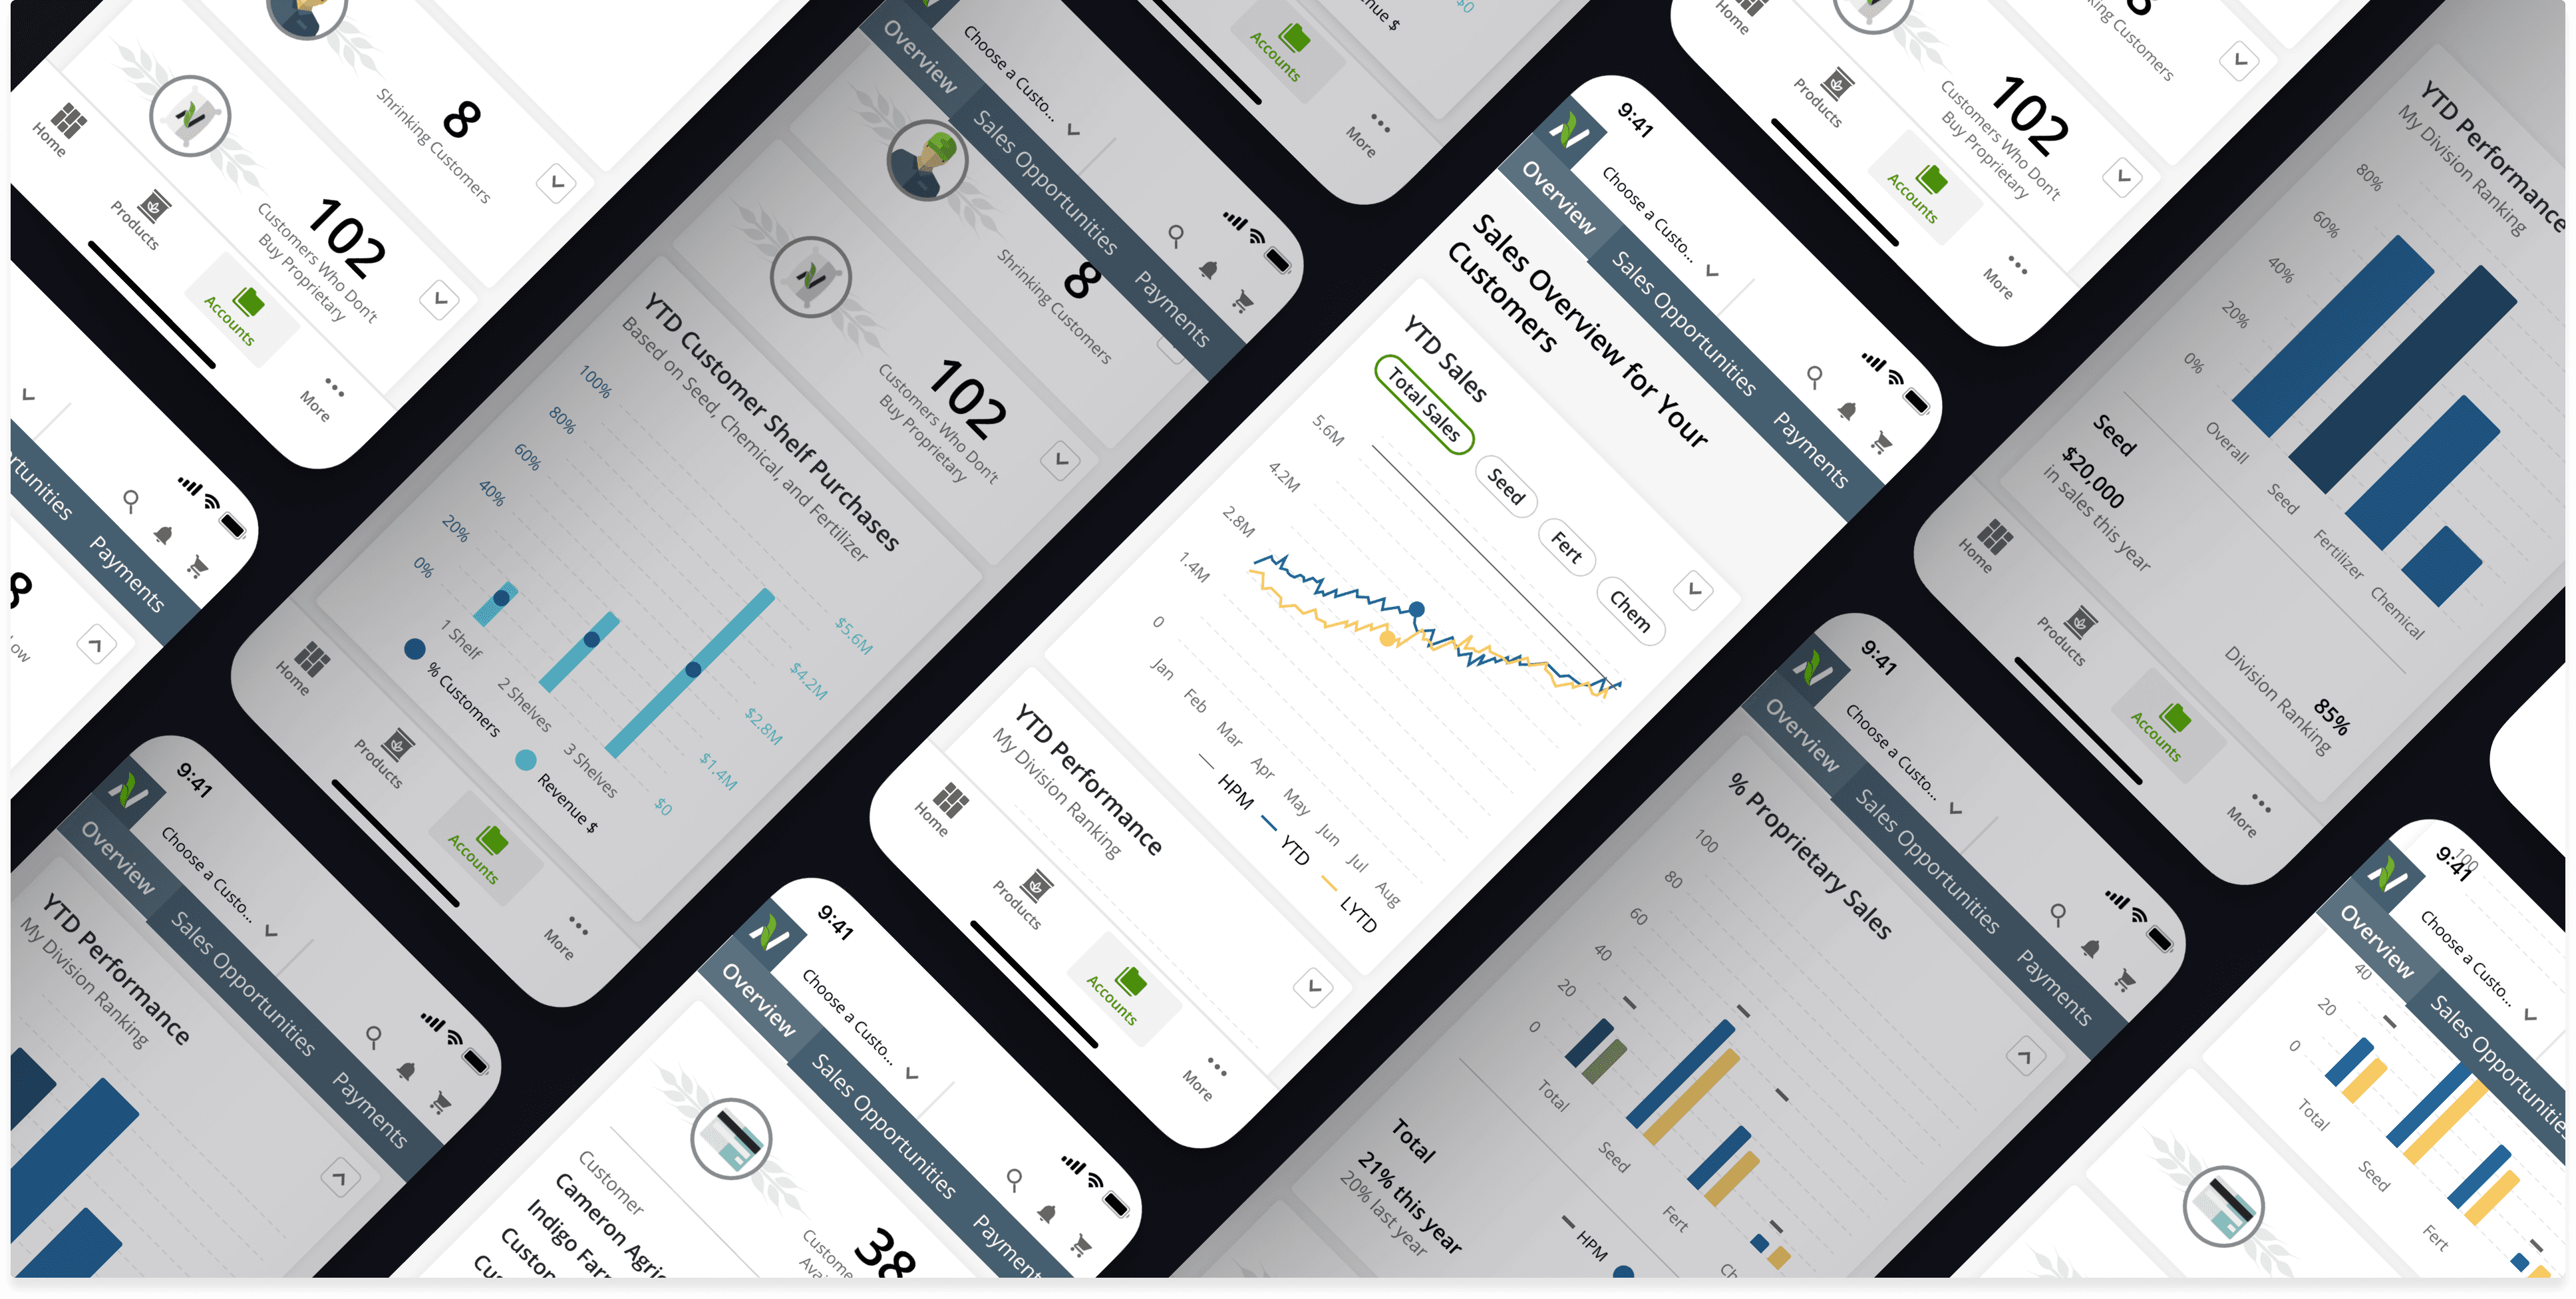
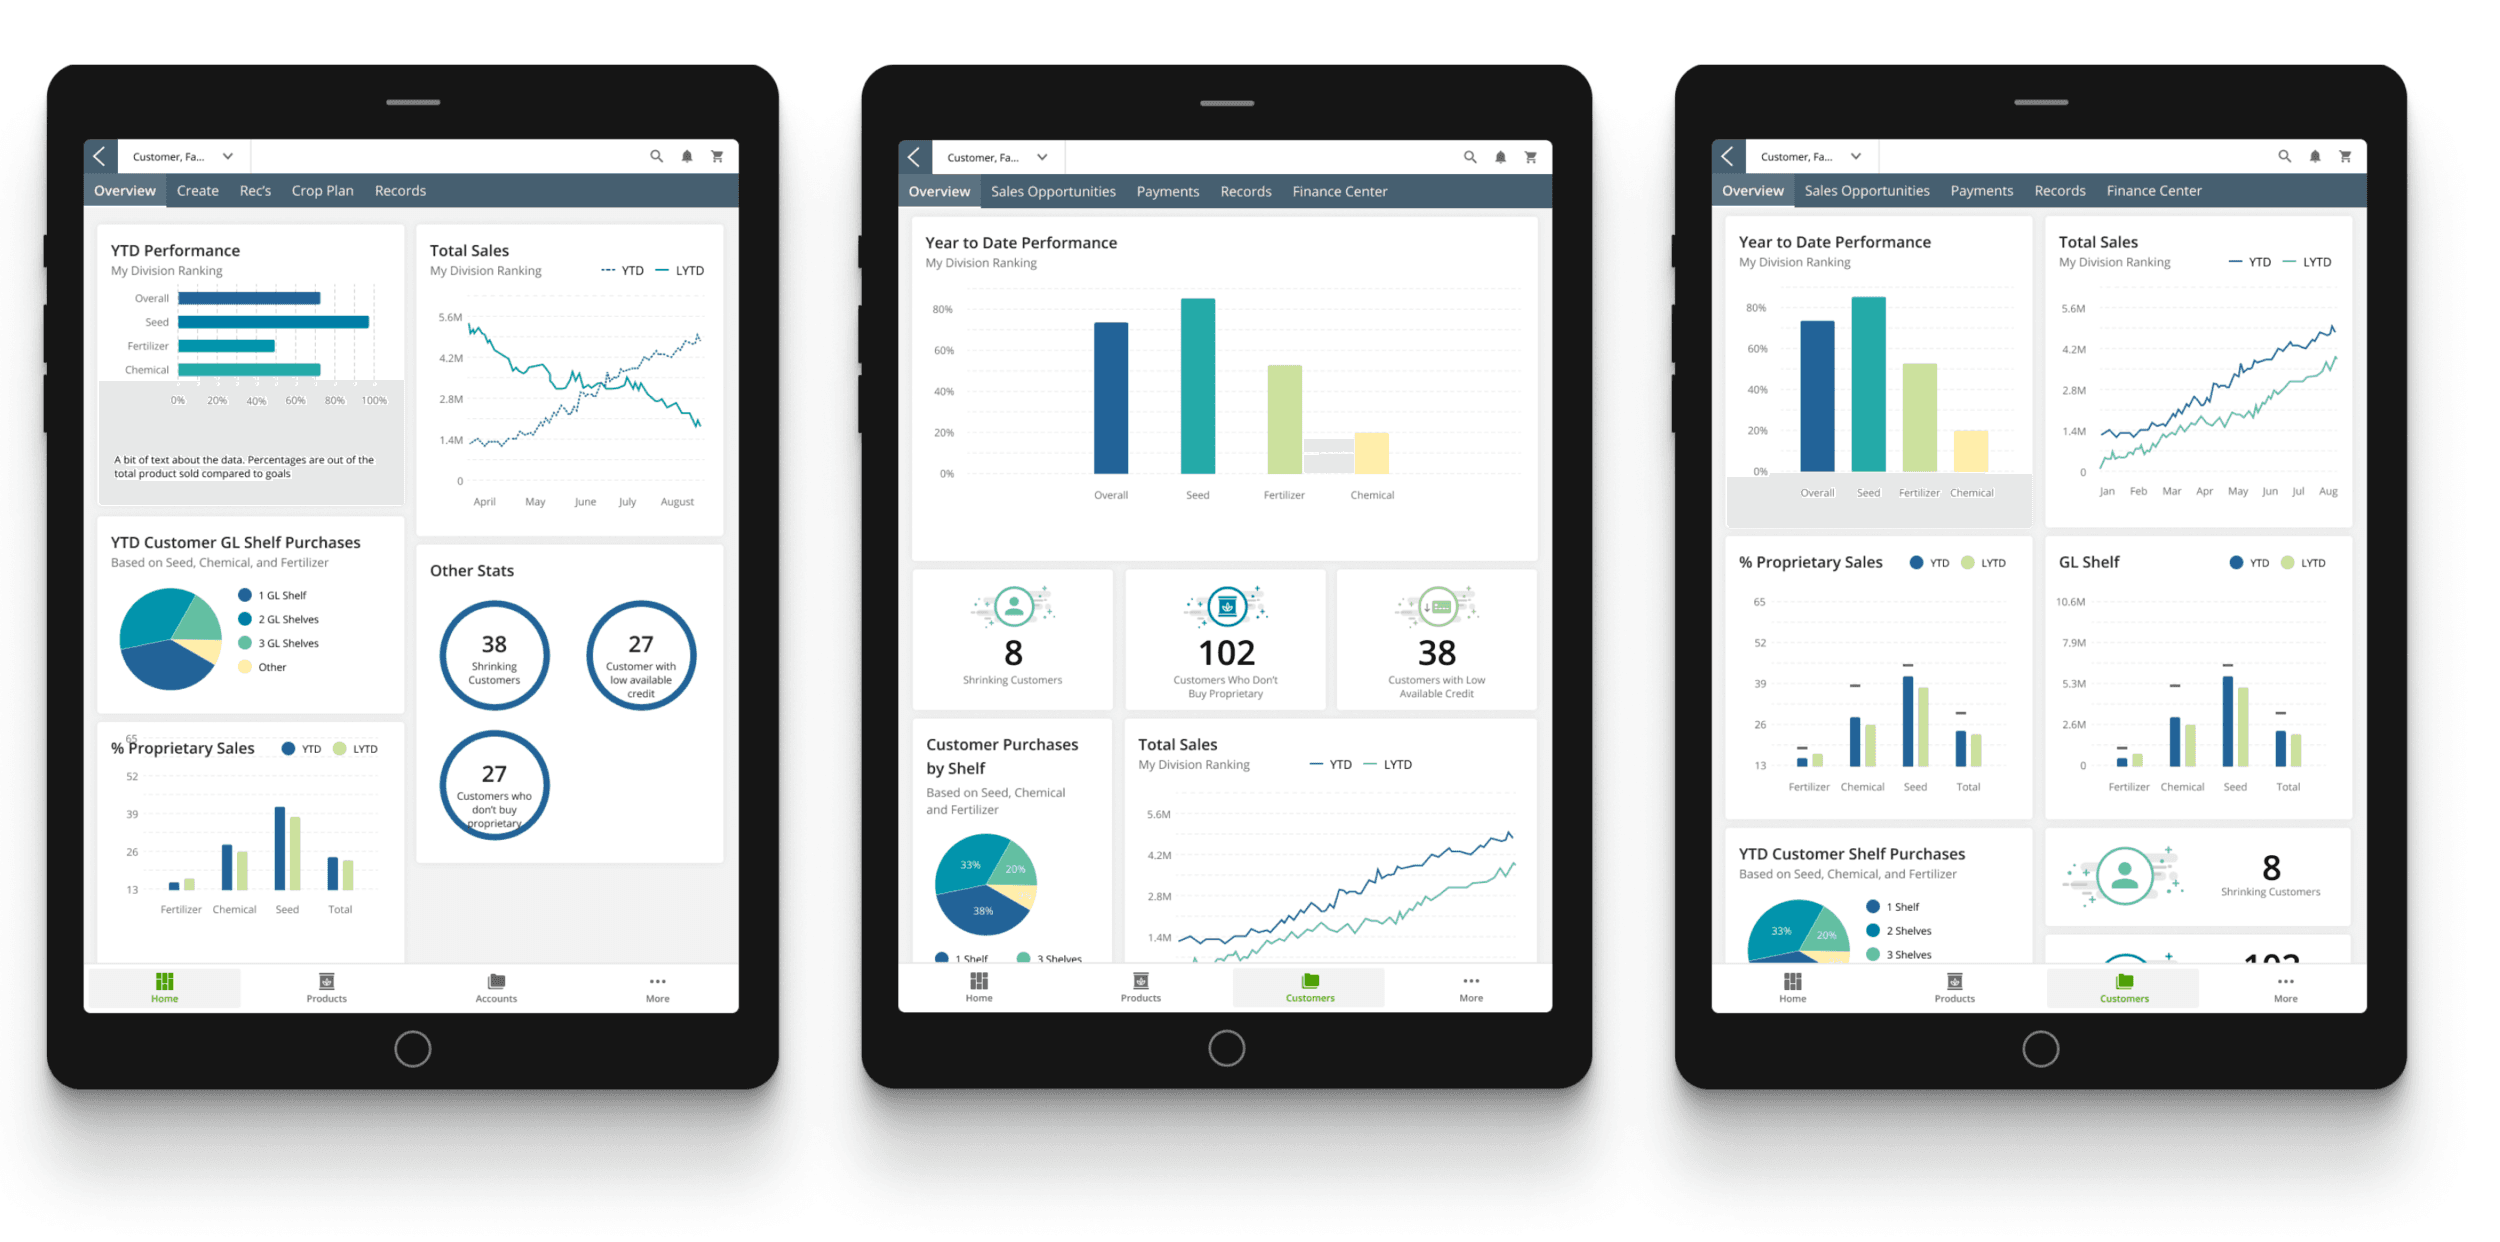
The images below show my second iteration where I was experimenting with a new layout, different breakpoints and new colors.

The Color Problem

The Color Problem

The Color Problem

While the original palette or greens and blues was aesthetically pleasing, the gradient of colors was difficult to read and comprehend in certain contexts; the colors were too similar to be distinctly identified at a glance. Levi ended up creating a new color palette that was better suited for our categorical data.

Interactivity

Interactivity

Interactivity

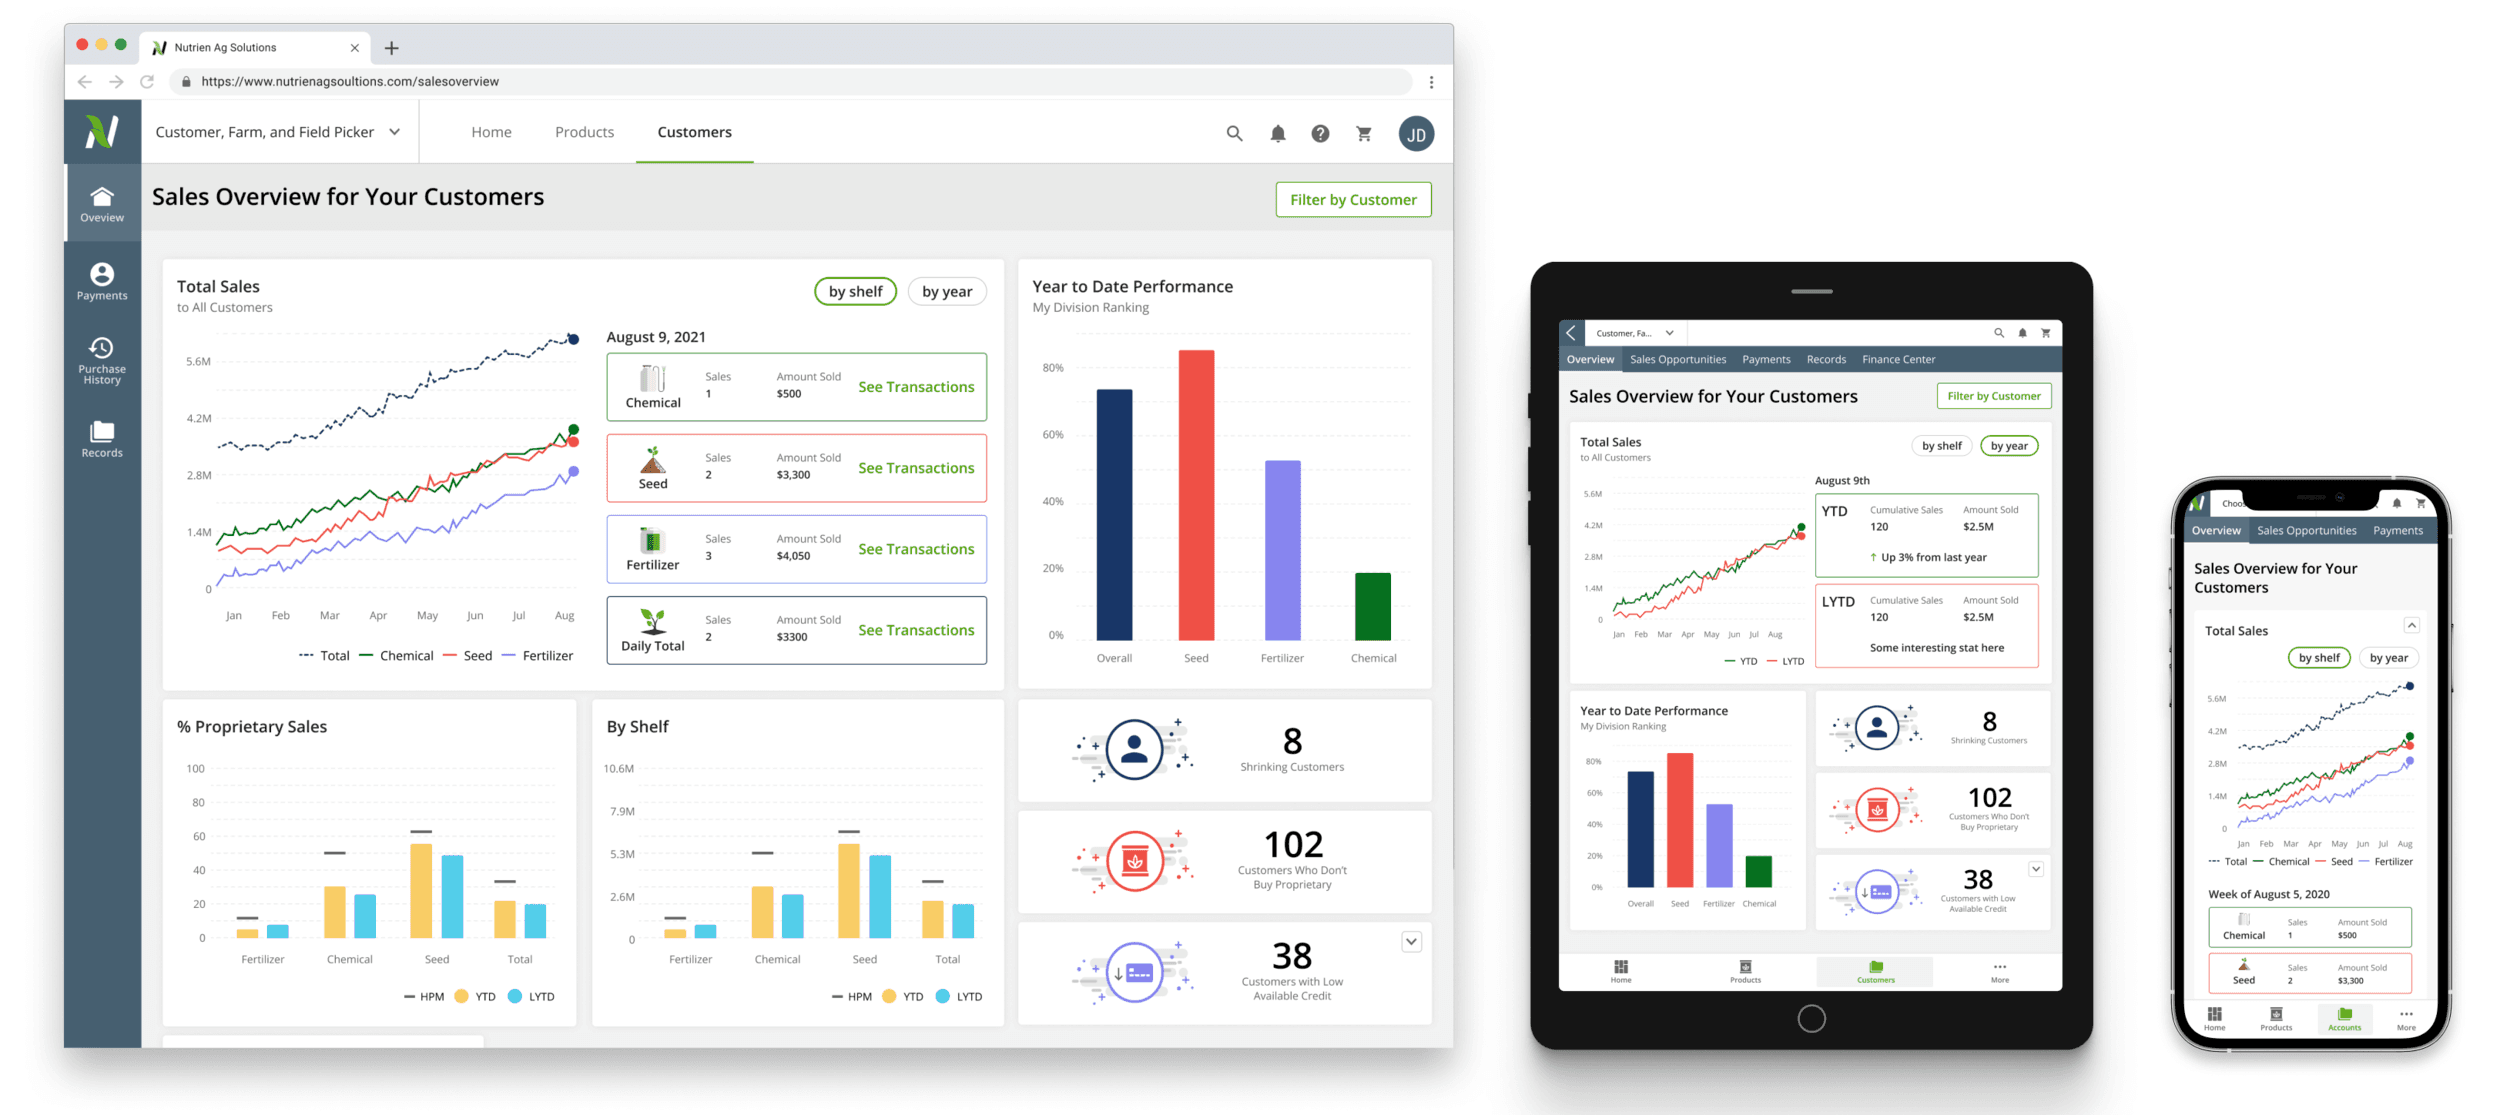
The components below tell the user a high-level story. By clicking on the graph, they will be presented with a bit more information. If that is still not enough information to answer their questions, they can dive even deeper into the data on a different page.

This staggered approach helps prevent the “drinking from a fire hose” effect of consuming too much information all at once.

Lastly is a video demoing the interactivity.

While UX design is my specialty, I am thrilled any time I get to flex my data visualization skills. Solving UI problems is a lot of fun!

While UX design is my specialty, I am thrilled any time I get to flex my data visualization skills. Solving UI problems is a lot of fun!

While UX design is my specialty, I am thrilled any time I get to flex my data visualization skills. Solving UI problems is a lot of fun!

Webster Designs

Golden, Colorado, USA

Find me on

Copyright © 2025 Webster Designs LLC - All Rights Reserved.

Webster Designs

Golden, Colorado, USA

Find me on

Copyright © 2025 Webster Designs LLC - All Rights Reserved.

Webster Designs

Golden, Colorado, USA

Find me on

Copyright © 2025 Webster Designs LLC - All Rights Reserved.

Webster Designs

Golden, Colorado, USA

Find me on

Copyright © 2025 Webster Designs LLC - All Rights Reserved.